CANDLESTICK PATTERNS
CandleStick
is a graphical summary of market price movements within a period of time. It can represent price movements that occurred over a period of 1 minute, 5 minutes, 15 minutes, 30 minutes, 1 hour, 4 hours, 1 day, 1 week or 1 month.
There are two types of Candlestick;
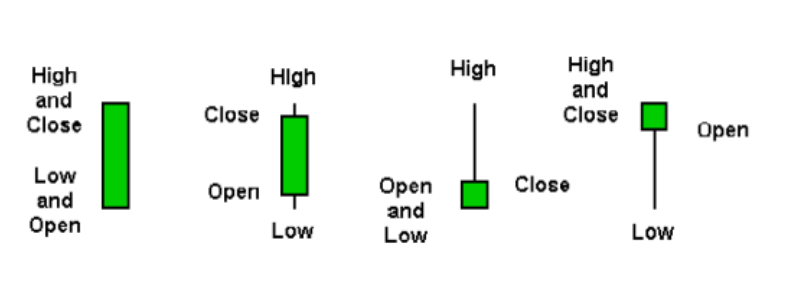
1. Bullish Candlestick
Simply means the price opened low and closed up higher after a certain period of time.
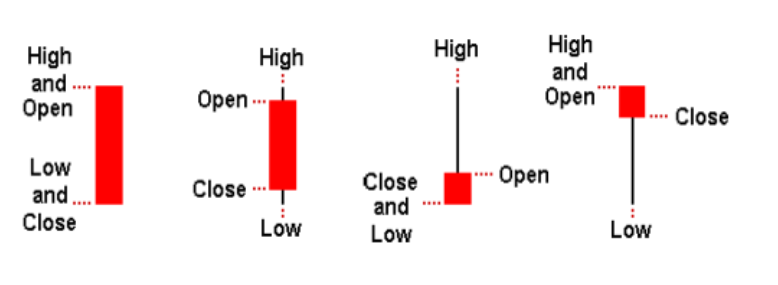
2. Bearish Candlestick
Simply means the price opened high and closed low after a certain period of time.
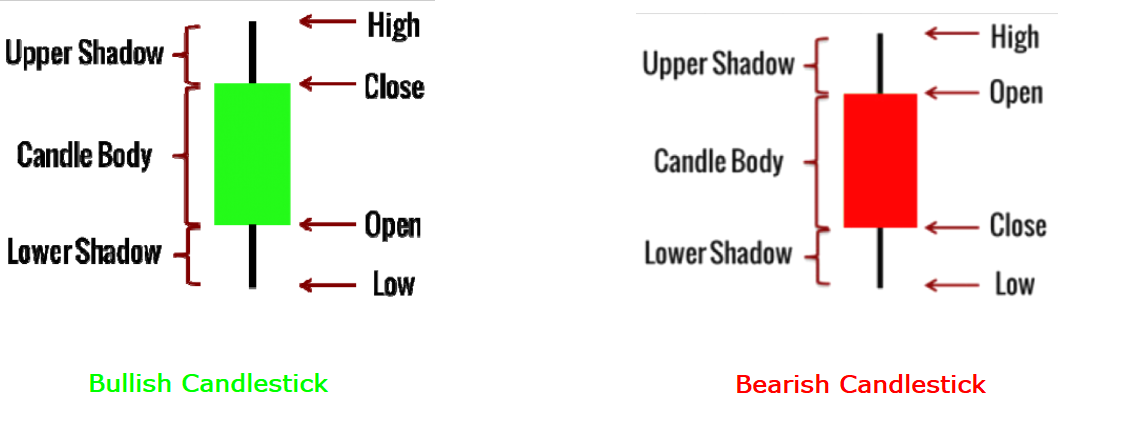
Bullish Candlestick (BUY):Shows open low and close high
Bearish Candlestick (SELL):Shows open high and close low
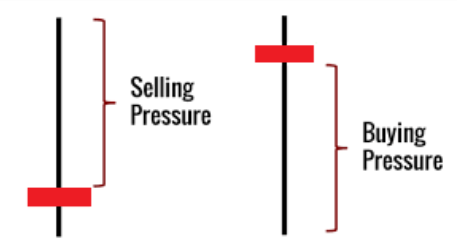
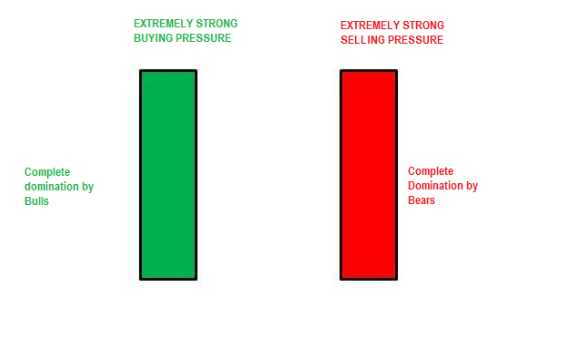
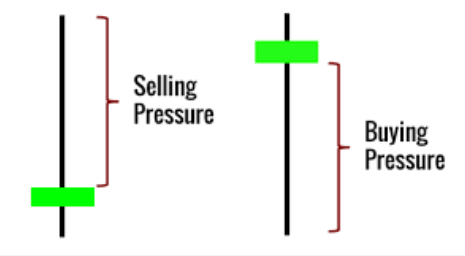 The longer the body of the candlestick the stronger the buying or selling pressure
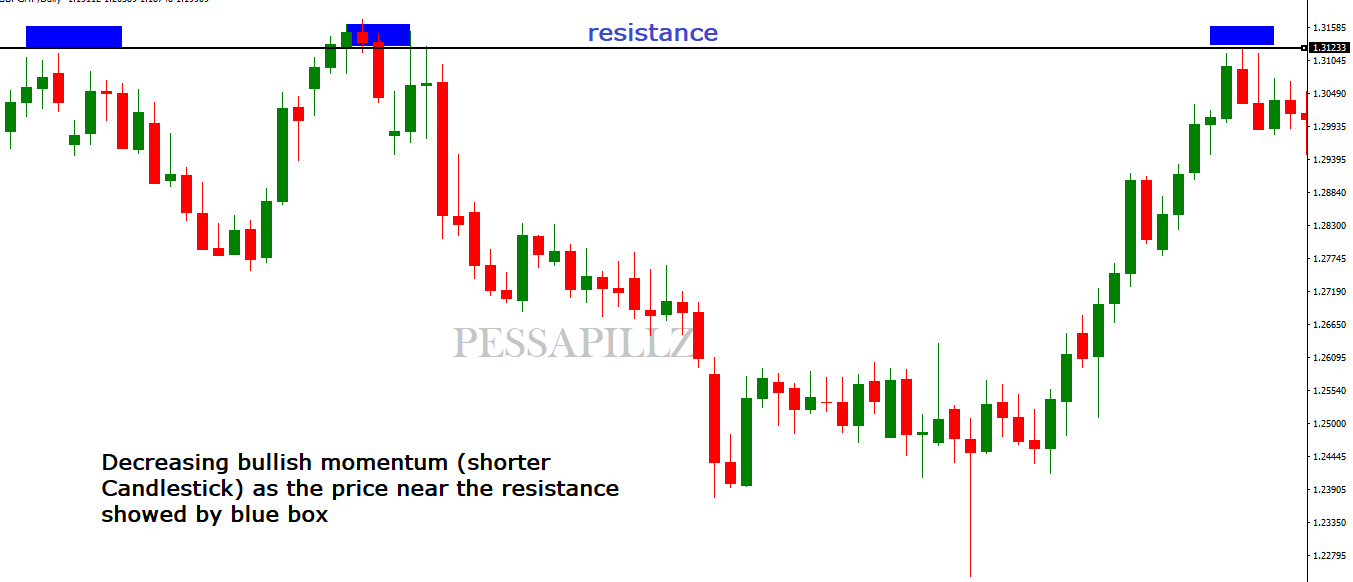
A group of candlesticks can show you how strong or weak a bullish or bearish move is.
The word used to describe such a situation is momentum.
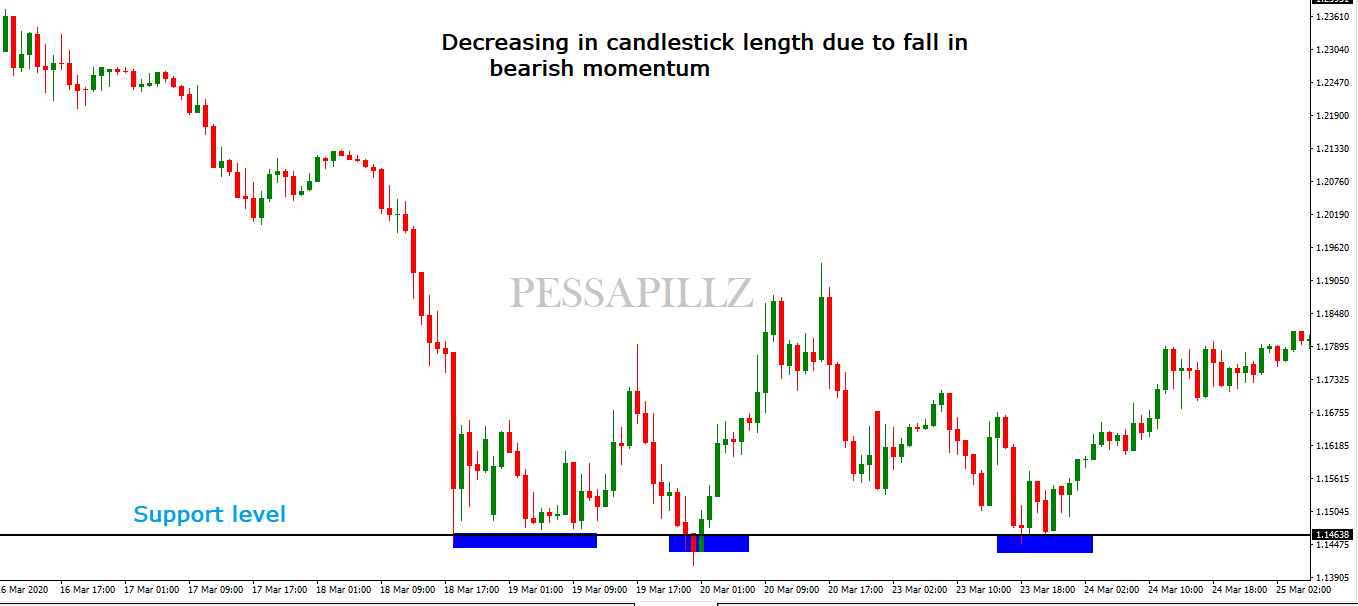
Three Bearish candlesticks in a downtrend, each with a decreasing body length.
This is a signal that the downtrend is weakening.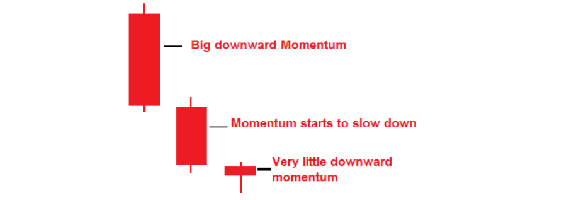
Three Bullish candlesticks in an uptrend, each with a decreasing body length.
This is a signal that the uptrend is weakening.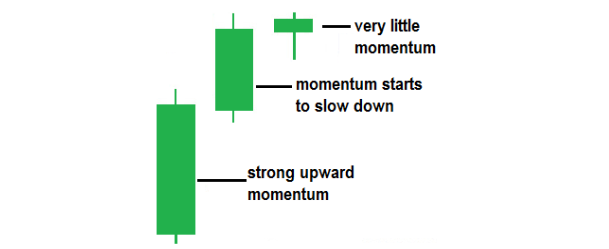
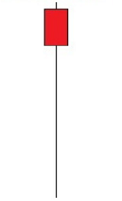
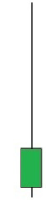
Candlestick Wicks/Shadow
 PRICE REJECTION CANDLES
This type of candlestick most formed at the resistance or support level;
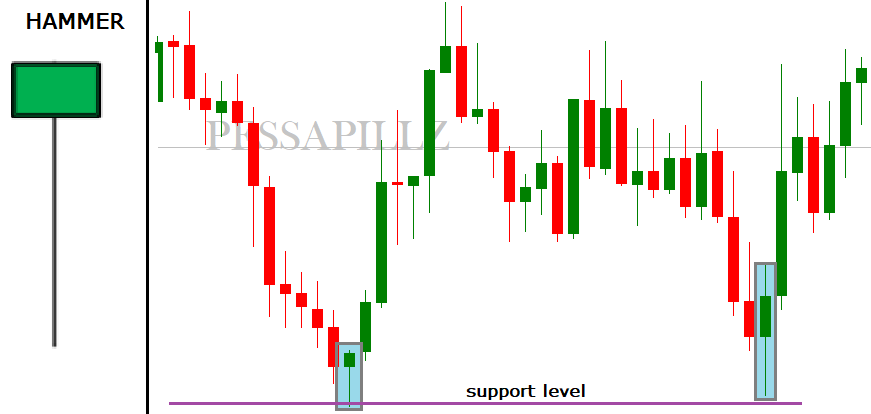
Hammer
Is a single candlestick and is a bullish reversal when formed around support level.
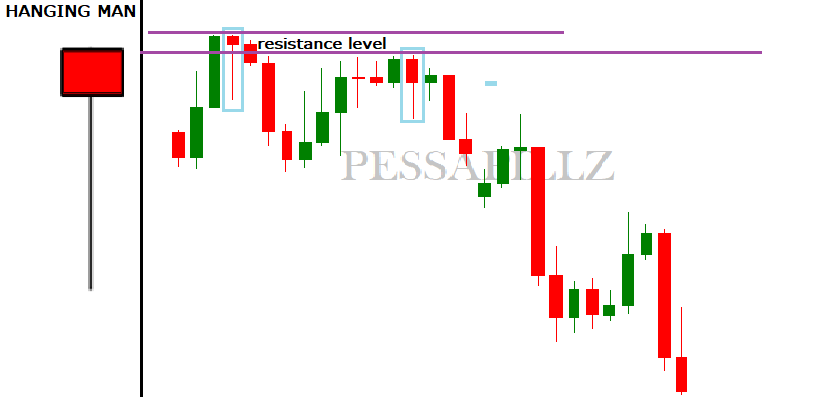
Hanging Man
Is a single candlestick and is a bearish reversal when formed around resistance level.
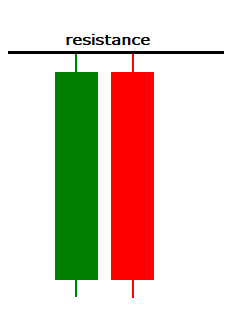
Railway Track
A railway track is a candlestick pattern consisting of two parallel candlesticks.
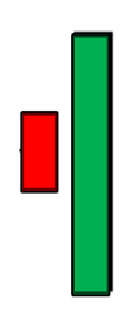
Bearish railway track
The first candlestick is bullish followed by a bearish candlestick of the same length and body.
When formed around resistance its signal to SELL
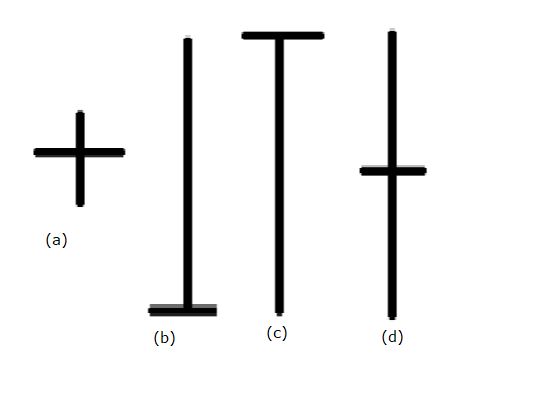
 Doji
Doji
A doji candlestick occurs when the open and closing price are equal.
Type of Doji candlestick
is a graphical summary of market price movements within a period of time. It can represent price movements that occurred over a period of 1 minute, 5 minutes, 15 minutes, 30 minutes, 1 hour, 4 hours, 1 day, 1 week or 1 month.
There are two types of Candlestick;
- Bullish Candlestick
- Bearish Candlestick
1. Bullish Candlestick
Simply means the price opened low and closed up higher after a certain period of time.
2. Bearish Candlestick
Simply means the price opened high and closed low after a certain period of time.
Bullish Candlestick (BUY):Shows open low and close high
Bearish Candlestick (SELL):Shows open high and close low
Understanding buying and selling pressure on candlesticks
Each Candlestick that forms tells you a story about the competition between the Buyers (Bulls) and the Sellers (Bears), who dominate the competition, who weakening and who finally won.- The first red candlestick on the left tells you that sellers (Bear) were dominant.
- The second red candlestick tells you the buyers (Bulls) were dominant.
- The first green candlestick on the left tells you that sellers (Bear) were dominant.
- The second green candlestick tells you the buyers (Bulls) were dominant.
Combination of candlestick to form candlestick patterns
We have been looking at individual candlesticks, what if we combine more than one candlestick ? what does that show us?A group of candlesticks can show you how strong or weak a bullish or bearish move is.
The word used to describe such a situation is momentum.
Three Bearish candlesticks in a downtrend, each with a decreasing body length.
This is a signal that the downtrend is weakening.
Three Bullish candlesticks in an uptrend, each with a decreasing body length.
This is a signal that the uptrend is weakening.
Candlestick Wicks/Shadow
- A wick is a long tail outside the body of the body candlestick.
- Long lower wicks occur when the downtrend is losing strength.
- A wick is a long tail outside the body of the body candlestick.
- Long upper wicks occur when the uptrend is losing strength.
ENGULFING CANDLES
This is a candle that covers the previous candle. that means it engulf the previous candle.- Bullish Engulfing Pattern
Now look at the bullish candle, you can see it has totally engulfed the bearidh candle, it has closed above it, it is a sign that the bull or buyers are likely to come into the market anytime soon. - The previous candle must be bearish.
- The bullish candle must engulf the previous.
How do we spot a bullish engulfing candle?
- Bearish Engulfing Pattern
This is where the close of the bearish candle closes below that previous candle (bullish candle). - The previous candle must be bullish.
- The bearish candle must engulf the previous candle.
How do we spot a bearish engulfing candle?
This type of candlestick most formed at the resistance or support level;
- Hammer
- Hanging Man
Hammer
Is a single candlestick and is a bullish reversal when formed around support level.
Hanging Man
Is a single candlestick and is a bearish reversal when formed around resistance level.
Railway Track
A railway track is a candlestick pattern consisting of two parallel candlesticks.
Bearish railway track
The first candlestick is bullish followed by a bearish candlestick of the same length and body.
When formed around resistance its signal to SELL
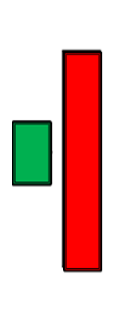
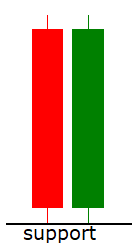
Bullish railway track
The first candlestick is bearish followed by a bullish candlestick of the same length and body.
When formed around support its signal to BUY
The first candlestick is bearish followed by a bullish candlestick of the same length and body.
When formed around support its signal to BUY
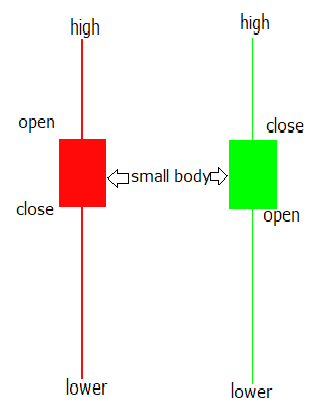
Spinning Top
This is a single candlestick and can be a continuation or reversal pattern.
A spinning top has a small body and long shadows on both sides that exceed the length of the body.
When formed around a support in a downtrend it's a signal to BUY.
When formed around a resistance in an uptrend it's a signal to SELL.
A doji candlestick occurs when the open and closing price are equal.
Type of Doji candlestick
- Bullish or bearish signal (Doji).
- Bearish reversal (Gravestone Doji).
- Bullish reversal(Dragonfly Doji).
- Bullish or Bearish depending on where it forms support or resistance (long-legged Doji).